This chapter presents a tutorial (in several parts) for using the Performance Analyzer; it contains these topics:
“Tutorial Setup”, describes how to compile the program used in the tutorial and how to set up your windows for use.
“Analyzing the Performance Data”, steps you through performance analysis experiments and results.
“Analyzing Memory Experiments”, steps you through experiments involving memory leaks and incorrect memory allocations and deallocations.
| Note: Because of inherent differences between systems and to concurrent processes that may be running on your system, your experiments will produce different results from the ones in this tutorial. However, the basic form of the results should be the same. |
The tutorial is based on a sample program called arraysum. The arraysum program goes through the following steps:
Defines the size of an array (2,000 by 2,000).
Creates a 2,000-by-2,000 element array, gets the size of the array, and reads in the elements.
Calculates the array total by adding up elements in each column.
Recalculates the array total differently, by adding up elements in each row.
It is more efficient to add the elements in an array row-by-row, as in step 4, than column-by-column, as in step 3. Because the elements in an array are stored sequentially by rows, adding the elements by columns potentially causes page faults and cache misses. The tutorial shows you how you can detect symptoms of problems like this and then zero in on the problem. The source code is located in /usr/demos/WorkShop/performance if you want to examine it.
You need to compile the program first so that you can use it in the tutorial.
Change to the /usr/demos/WorkShop/performance directory.
You can run the experiment in this directory or set up your own directory.
Compile the arraysum.c file by entering the following:
% make arraysum
This will provide you with an executable for the experiment, if one does not already exist.
From the command line, enter the following:
% cvd arraysum &
The Debugger Main View window is displayed. You need the Debugger to specify the data to be collected and to run the experiment. If you want to change the font in a WorkShop window, see “Changing Window Font Size”.
Choose User Time/Callstack Sampling from the Select Task submenu in the Perf menu.
This is a performance task that will return the time your program is actually running and the time the operating system spends performing services such as I/O and executing system calls. It includes the time spent in each function.
If you want to watch the progress of the experiment, choose Execution View in the Views menu. Then click Run in the Debugger Main View window.
This starts the experiment. When the status line indicates that the process has terminated, the experiment has completed. The main Performance Analyzer window is displayed automatically. The experiment may take 1 to 3 minutes, depending on your system. The output file will appear in a newly created directory, named test0000.
You can also generate an experiment using the ssrun(1) command with the -workshop option, naming the output file on the cvperf(1) command. In the following example, the output file from ssrun is arraysum.usertime.m2344.
% ssrun -workshop -usertime arraysum % cvperf arraysum.usertime.m2344 |
If you are analyzing your experiment on the same machine you generated it on, you do not need the -workshop option. If the _SPEEDSHOP_OUTPUT_FILENAME environment variable is set to a file name, such as my_prog, the experiment file from the example above would be my_prog.m2345. See the ssrun(1) man page or the Speedshop User's Guide for more SpeedShop environment variables.
If you want to change the font size on a WorkShop window, you can do so in your .Xresources or .Xdefaults file. Follow this procedure:
Enter the editres(1) command to get the names of the WorkShop window widgets.
Add lines such as the following to your .Xresources or .Xdefaults file:
The first changes the main window font, and the others change fonts more selectively.cvmain*fontList: 6x13 cvmain*tabPanel*fontList: fixed cvmain*popup_optionMenu*fontList: fixed cvmain*canvasPopup*fontList: 6x13 cvmain*tabLabel.fontList: 6x13 cvmain*help*fontList: 6x13 cvmain*UiOverWindowLabel*fontList: 6x13 cvmp*fontList: 6x13 Enter the command xrdb (1) to update the windows.
Performance analysis experiments are set up and run in the Debugger window; the data is analyzed in the main Performance Analyzer window. The Performance Analyzer can display any data generated by the ssrun(1) command, by any of the Debugger window performance tasks (which use the ssrun(1) command).
| Note: Again, the timings and displays shown in this tutorial could be quite different from those on your system. For example, setting caliper points in the time line may not give you the same results as those shown in the tutorial, because the program will probably run at a different speed on your system. |
Examine the main Performance Analyzer window, which is invoked automatically if you created your experiment file from the cvd window.
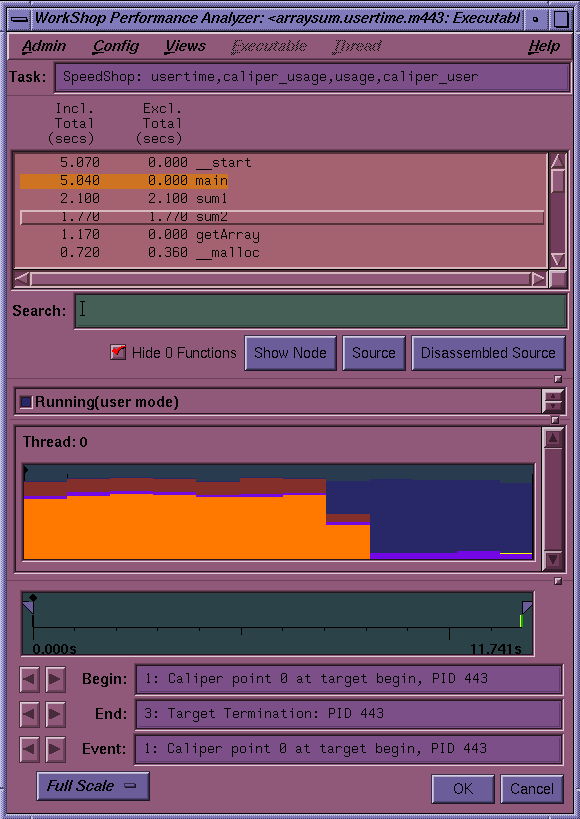
The Performance Analyzer window now displays the information from the new experiment (see Figure 3-1).
Look at the usage chart in the Performance Analyzer window.
The first phase is I/O-intensive. The second phase, during which the calculations took place, shows high user time.
Select Usage View (Graphs) from the Views menu.
The Usage View (Graphs) window displays. It shows high read activity and high system calls in the first phase, confirming the hypothesis that it is I/O-intensive.
Select Call Stack View from the Views menu on the Performance Analyzer Main Window.
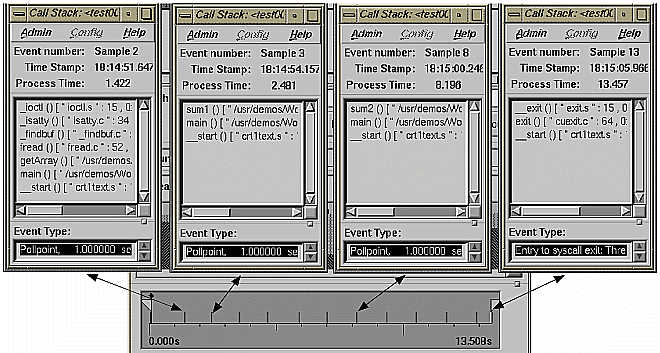
The call stack displays for the selected event. An event refers to a sample point on the time line (or any usage chart).
At this point, no events have been selected so the call stack is empty. To define events, you can add calls to ssrt_caliper_point to record caliper points in the source file, set a sample trap from the WorkShop Debugger window, or set pollpoint calipers on the time line. (For more information on the ssrt_caliber_point function, see the ssapi(3) man page.) See Figure 3-2 for an illustration of how the Call Stack View responds when various caliper points are recorded.
Return to the Performance Analyzer window and pull down the sash to expose the complete function list.
This shows the inclusive time (that is, time spent in the function and its called functions) and exclusive time (time in the function itself only) for each function. More time is spent in sum1 than in sum2.
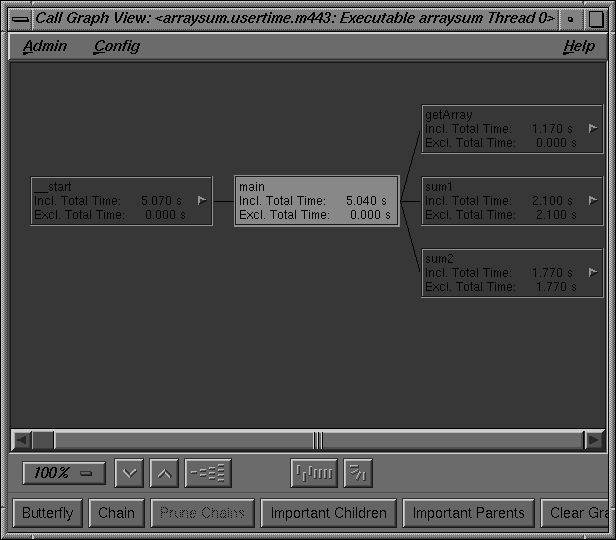
Select Call Graph View from the Views menu and click on the Butterfly button.
The call graph provides an alternate means of viewing function performance data. It also shows relationships, that is, which functions call which functions. After the Butterfly button is clicked, the Call Graph View window appears, as shown in Figure 3-3. The Butterfly button takes the selected function (or most active function if none is selected) and displays it with the functions that call it and those that it calls.
Select Close from the Admin menu in the Call Graph View window to close it. Return to the main Performance Analyzer window.
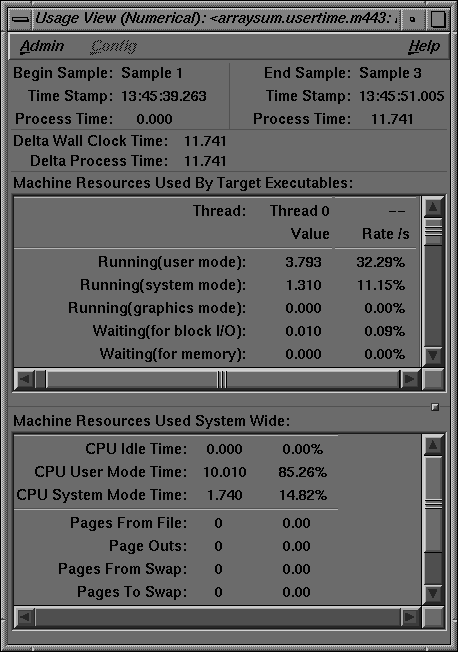
Select Usage View (Numerical) from the Views menu.
The Usage View (Numerical) window appears as shown in Figure 3-4.
Return to the main Performance Analyzer window, select sum1 from the function list, and click Source.
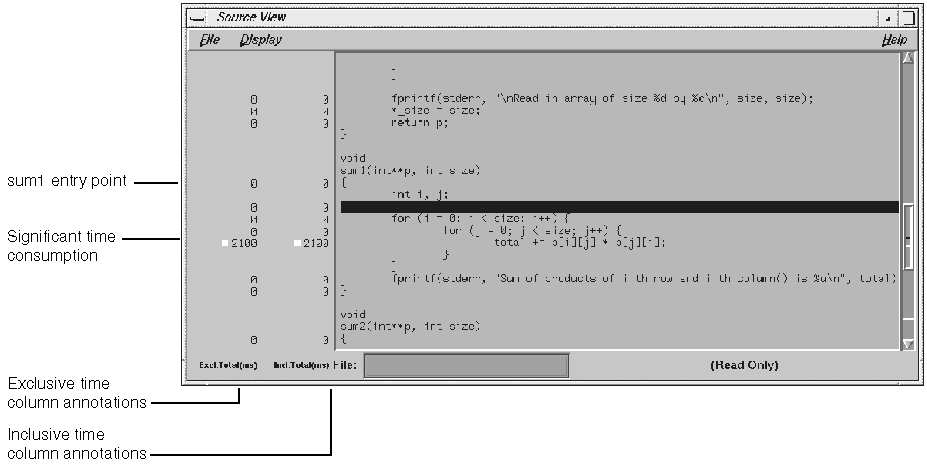
The Source View window displays as shown in Figure 3-5, scrolled to sum1, the selected function. The annotation column to the left of the display area shows the performance metrics by line. Lines consuming more than 90% of a particular resource appear with highlighted annotations.
Notice that the line where the total is computed in sum1 is seen to be the culprit, consuming 2,100 milliseconds. As in the other WorkShop tools, you can make corrections in Source View, recompile, and try out your changes.
At this point, one performance problem is found: the sum1 algorithm is inefficient. As a side exercise, you may want to take a look at the performance metrics at the assembly level. To do this, return to the main Performance Analyzer window, select sum1 from the function list, and click Disassembled Source. The disassembly view displays the assembly language version of the program with the performance metrics in the annotation column.
Close any windows that are still open.
This concludes the tutorial.
Memory experiments give you information on what kinds of memory errors are happening in your program and where they are occurring.
The first tutorial in this section finds memory leaks, situations in which memory allocations are not matched by deallocations.
The second tutorial in this section (“Memory Use”) analyzes memory use.
To look for memory leaks or bad free routines, or to perform other analysis of memory allocation, run a Performance Analyzer experiment with Memory Leak Trace specified as the experiment task. You run a memory corruption experiment like any performance analysis experiment, by clicking Run in the Debugger Main View. The Performance Analyzer keeps track of each malloc (memory allocation), realloc (reallocation of memory), and free (deallocating memory).
To run this tutorial, first copy the files you will need into a new directory:
Create a new directory:
% mkdir mydirectory
Change to the SpeedShop directory and copy the files:
% cd /usr/demos/SpeedShop
Copy the necessary files to your directory:
% cp -r generic ~/mydirectory
Compile the necessary files:
% cd ~/mydirectory/generic
% make all
The general steps in running a memory experiment are as follows:
Display the WorkShop Debugger, including the executable file (generic, in this case, from the /usr/demos/SpeedShop directory) as an argument.
cvd generic &
Specify Memory Leak Trace as the experiment task.
Memory Leak Trace is a selection on the Perf menu.
Run the experiment.
You run experiments by clicking the Run button.
The Performance Analyzer window is displayed automatically with the experiment information.
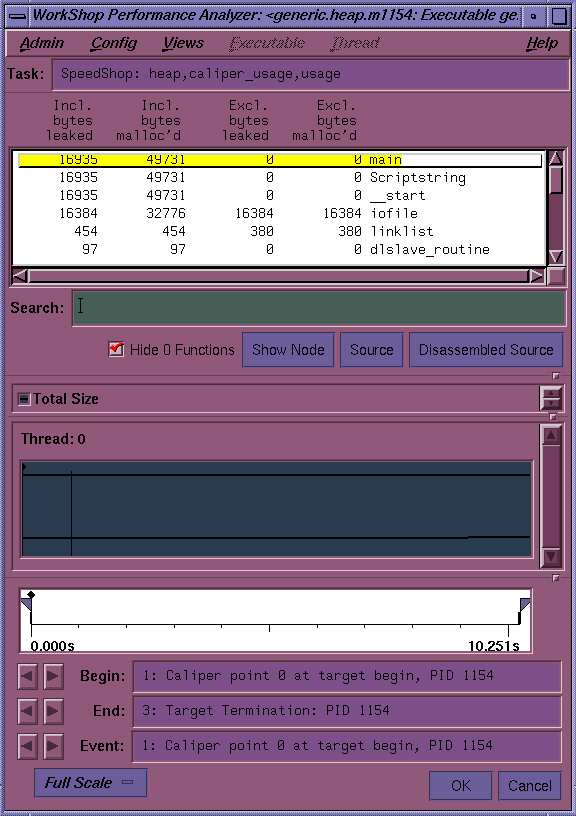
The Performance Analyzer window displays results appropriate to the task selected. Figure 3-6, shows the Performance Analyzer window after a memory experiment.
The function list displays inclusive and exclusive bytes leaked and allocated with malloc per function. Clicking Source brings up the Source View, which displays the function's source code annotated with bytes leaked and allocated by malloc. You can set other annotations in Source View and the function list by choosing Preferences... from the Config menu in the Performance Analyzer window and selecting the desired items.
Analyze the results of the experiment in Leak View when doing leak detection and Malloc Error View when performing broader memory allocation analysis. To see all memory operations, whether problems or not, use Malloc View . To view memory problems within the memory map, use Heap View.
Exit the debugger by selecting Admin -> Exit from the Main View Window..
In this tutorial, you will run an experiment to analyze memory use. The program generates memory problems that you can detect using the Performance Analyzer and the following instructions:
Go to the /usr/demos/WorkShop/mallocbug directory. The executable mallocbug was compiled as follows:
% cc -g -o mallocbug mallocbug.c -lc
Invoke the Debugger by typing:
% cvd mallocbug
Bring up a list of the performance tasks by selecting Select Task from the Perf menu.
Select Memory Leak Trace from the menu and click Run to begin the experiment. The program runs quickly and terminates.
The Performance Analyzer window appears automatically. A dialog box indicating malloc errors displays also.
Select Malloc View from the Performance Analyzer Views menu.
The Malloc View window displays, indicating two malloc locations.
Select Malloc Error View from the Performance Analyzer Views menu.
The Malloc Error View window displays, showing one problem, a bad free, and its associated call stack. This problem occurred 99 times
Select Leak View from the Performance Analyzer Views menu.
The Leak View window displays, showing one leak and its associated call stack. This leak occurred 99 times for a total of 99,000 leaked bytes.
Double-click the function foo in the call stack area.
The Source View window displays, showing the function's code, annotated by the exclusive and inclusive leaks and the exclusive and inclusive calls to malloc.
Select Heap View from the Performance Analyzer Views menu.
The Heap View window displays the heap size and other information at the top. The heap map area of the window shows the heap map as a continuous, wrapping horizontal rectangle. The rectangle is broken up into color-coded segments, according to memory use status. Color-coded indicators are displayed in the scroll bar trough. At the bottom of the heap map area are: the Search field, for identifying or finding memory locations; the Malloc Errors button, for finding memory problems; a Zoom In button (upward pointing arrow) and a Zoom Out button (downward pointing arrow).
The event list area and the call stack area are at the bottom of the window. Clicking any event in the heap map area displays the appropriate information in these fields.
Click on any memory block in the heap map.
The beginning memory address appears in the Search field. The event information displays in the event list area. The call stack information for the last event appears in the call stack area.
Select other memory blocks to try out this feature.
As you select other blocks, the data at the bottom of the Heap View window changes.
Double-click on a frame in the call stack area.
A Source View window comes up with the corresponding source code displayed.
Close the Source View window.
Click the Malloc Errors button.
The data in the Heap View information window changes to display memory problems. Note that a free may be unmatched within the analysis interval, yet it may have a corresponding free outside of the interval.
Click Close to leave the Heap View window.
Select Exit from the Admin menu in any open window to end the experiment.
