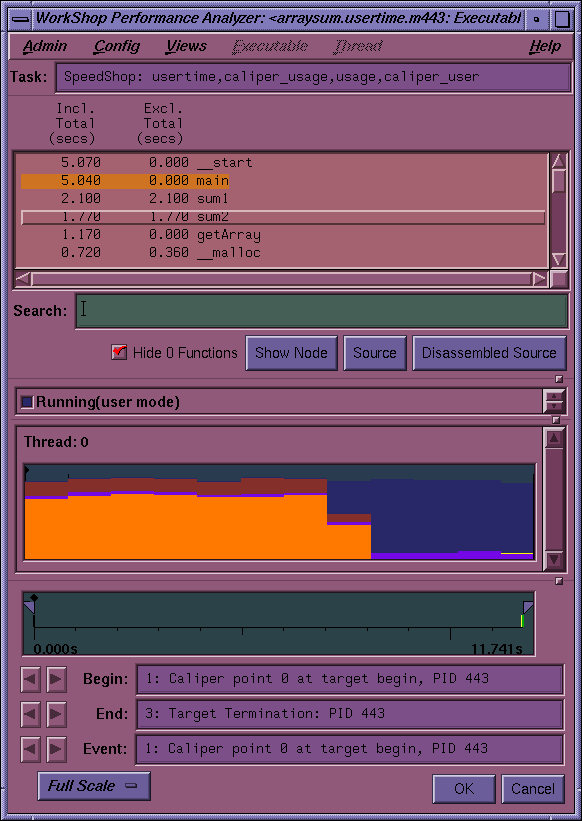
This chapter describes the major windows in the Performance Analyzer toolset. The main window (see Figure 2-1) contains the following major areas:
The function list area, which shows functions with their performance metrics.
The system resource usage chart, which shows the mode of the program at any time.
The time line, which shows when sample events occur in the experiment and controls the scope of analysis for the Performance Analyzer views.
Supplemental views bring up their own windows. For more information, see the following subsections:
The time line display shows the experiment as a set of events over time and provides caliper markers to let you specify an interval of interest. See “The Time Line Display”, for more information.
The Usage View (Graphs) displays process resource usage data, such as what the program is doing at any time, the amount of data read and written, the memory size of the program, and so on. The data is presented in the form of graphs. See “Resource Usage Graphs”.
The Usage View (Numerical) presents a textual display of the process and system-wide resource usage data. See “Usage View (Numerical)”.
The I/O View displays a chart of the number of bytes for each I/O transfer. See “I/O View”.
The MPI Stats View (Graphs) displays data in a graphical format for multiprocessor programs using the Message Passing Interface (MPI). See “MPI Stats View (Graphs)”.
The MPI Stats View (Numerical) displays MPI data in text format. See “MPI Stats View (Numerical)”.
The Parallel Overhead View displays the unproductive time spent in an MPI, OpenMP, or pthreads parallel program. See “The Parallel Overhead View”.
The function list area displays the program's functions with associated performance metrics. See “The Function List Area”.
The Call Graph View presents the target program as nodes and arcs, along with associated metrics. See “Call Graph View”.
The Butterfly View presents a selected function along with the functions that called it and the functions that it called. See “Butterfly View”.
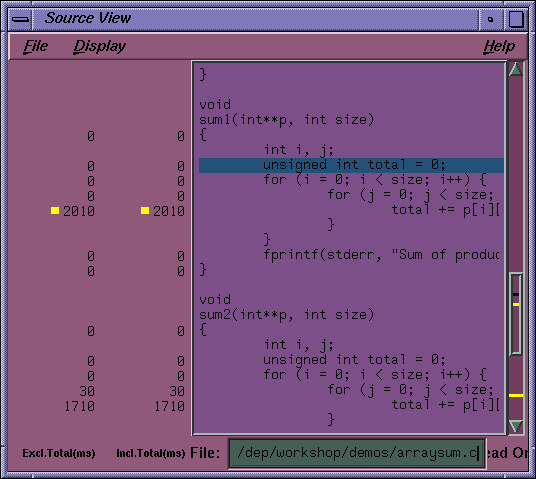
Source View with performance annotations, see “Viewing Source Code with Performance Annotations”.
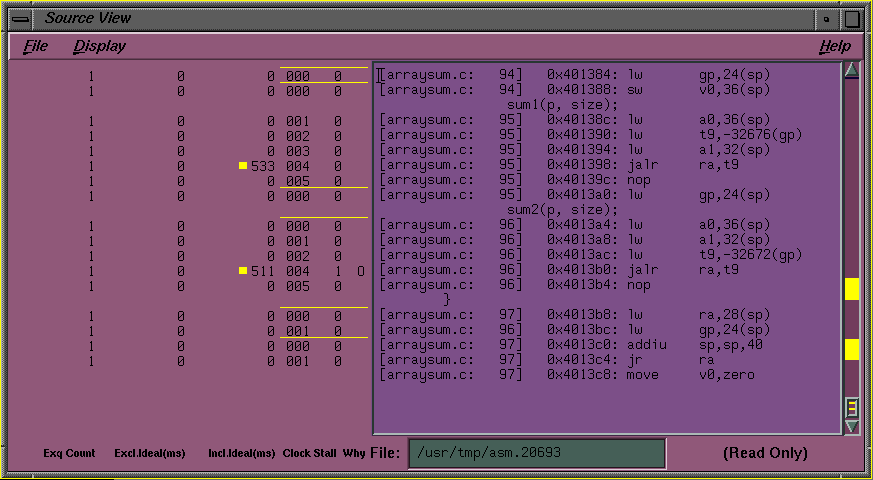
Disassembled Source with performance annotations, see “Viewing Metrics by Machine Instruction”.
Malloc Error View, Leak View, Malloc View, and Heap View, see “Leak View, Malloc View, Malloc Error View, and Heap View”.
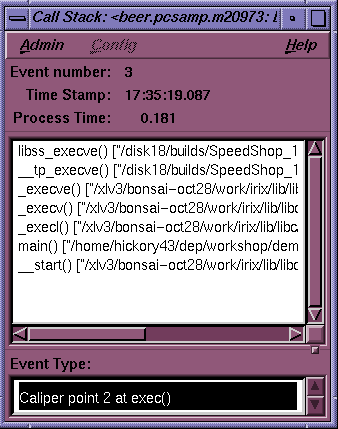
The Call Stack View shows the path through functions that led to an event. See “Call Stack View”.
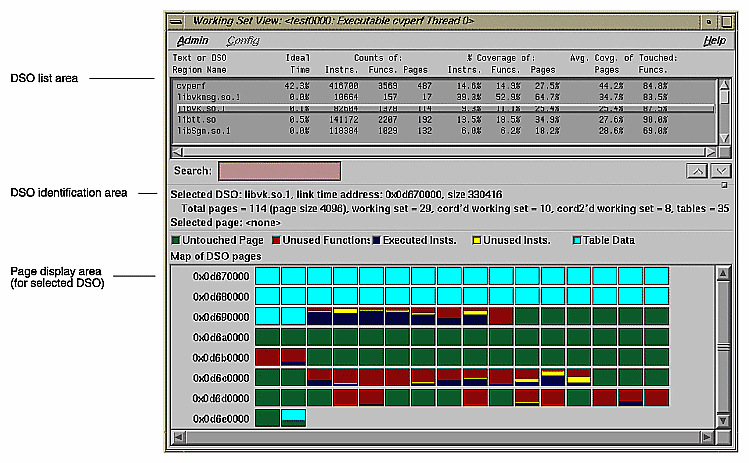
The Working Set View displays a list of the DSOs in the program, with information on the efficiency of use of the text (instruction) pages. See “Working Set View”.
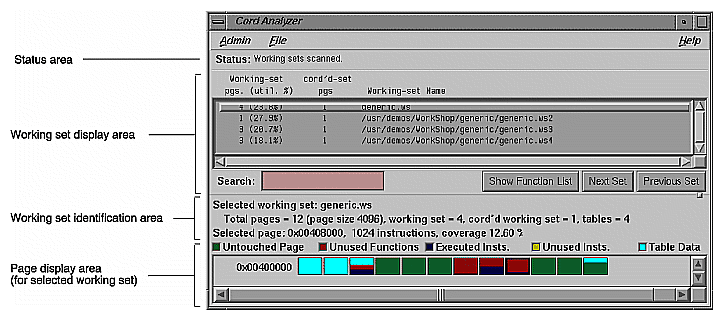
The cord analyzer lets you explore the working set behavior of an executable or DOS. See “Cord Analyzer”.
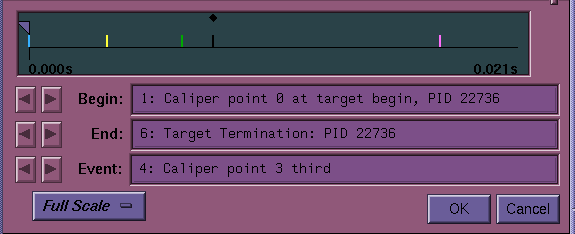
The Performance Analyzer time line can act like a stopwatch to time your program. The time line shows where each sample event in the experiment occurred. By setting sample traps at phase boundaries, you can analyze metrics on a phase-by-phase basis. The simplest metric, time, is easily recognized as the space between events. The triangular icons are calipers; they let you set the scope of analysis to the interval between the selected events.
Figure 2-2 shows the time line portion of the Performance Analyzer window with typical results. Event number 4 is selected; it is labeled according to the caliper number, third. You can see from the graph that the phase between the selected event and event number 5 is taking more of the program's time than any of the other phases.
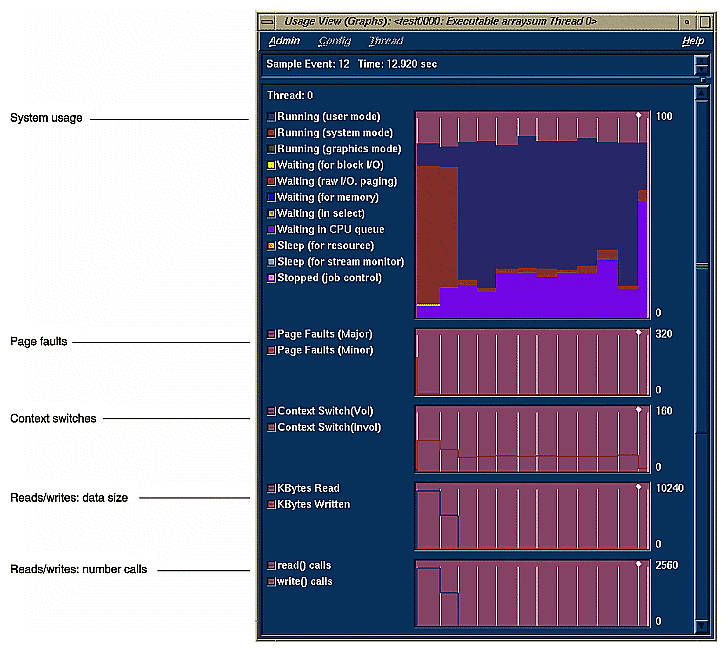
The Performance Analyzer lets you look at how different resources are consumed over time. It produces a number of resource usage graphs that are tied to the time line (see Figure 2-3, which shows five of the graphs available). These resource usage graphs indicate trends and let you pinpoint problems within phases.
Resource usage data refers to items that consume system resources. They include:
The state of the program at any given time. The states include running in user mode, running in system mode, waiting in the CPU queue, and so on.
Page faults.
Context switches, or when one job is replaced in the CPU by another job.
The size of reads and writes.
Read and write counts.
Poll and I/O calls. (See the poll (2), ioctl(2), and streamio(7) man pages for more information on what this chart measures.)
Total system calls.
Process signals received.
Process size in memory.
Resource usage data is recorded periodically: by default, every second. If you discover inconsistent behavior within a phase, you can change the interval and break the phase down into smaller phases.
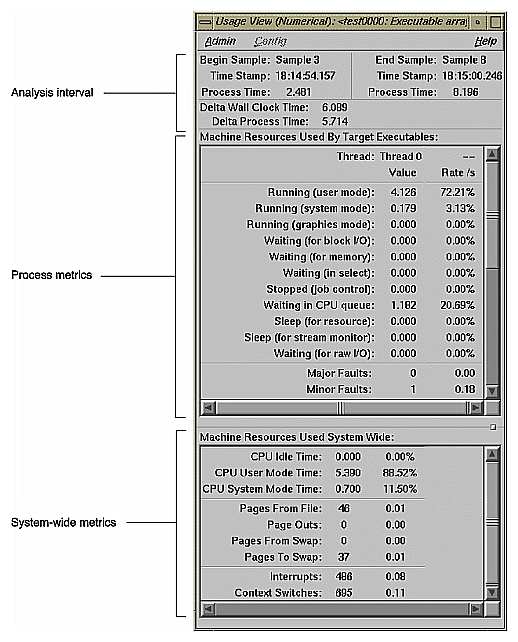
You can analyze resource usage trends in the charts in Usage View (Graphs) and can view the numerical values in the Usage View (Numerical) window.
The usage graphs show the patterns; the textual usage views let you view the aggregate values for the interval specified by the time line calipers. Figure 2-4, shows a typical Usage View (Numerical) window.
I/O View helps you determine the problems in an I/O-bound process. It produces a graph of all I/O system calls and identifies up to 10 files involved in I/O. By selecting an event with the left mouse button, you can display the call stack corresponding to the event in the Call Stack View. See Figure 2-5.
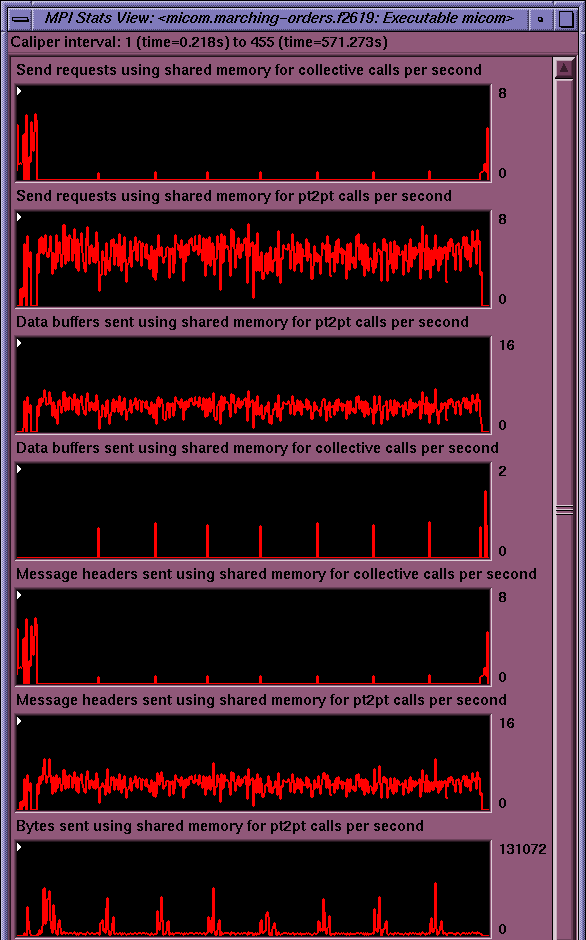
If you are running a multiprocessor program that uses the Message Passing Interface (MPI), the MPI Stats View (Graphs) view can help you tune your program. The graphs display data from the complete program.
Both the graphs view and the numerical view (see the following section) use data collected by the MPI library and recorded by SpeedShop. Versions of the MPI library older than MPT 1.3 do not provide the data needed by these views. The MPI statistical data is recorded as part of the resource usage data, so the interval between resource usage samples is also the interval between MPI statistical samples.
The following figure shows the graphs from a large MPI program.
The Parallel Overhead View displays the overhead (or, unproductive time) spent in an MPI, OpenMP, or pthreads program.
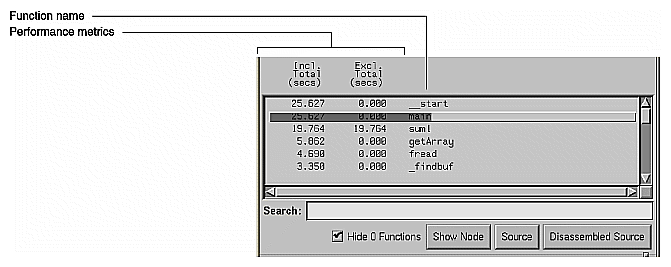
The function list area displays all functions in the source code, annotated by performance metrics and ranked by the criterion of your choice, such as counts or one of the time metrics. Figure 2-7 shows an example of the function list, ranked by inclusive CPU time.
You can configure how functions appear in the function list area by selecting Preferences... in the Config menu. It lets you select which performance metrics display, whether they display as percentages or absolute values, and the style of the function name. The Sort... selection in the Config menu lets you order the functions in the list by the selected metric. Both selections disable those metric selections that were not collected in the current experiment.
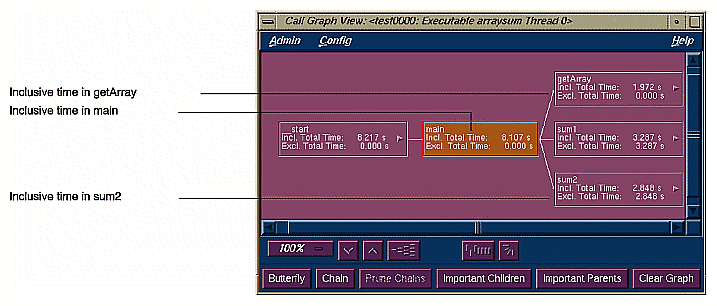
In contrast to the function list, which provides the performance metrics for functions, the call graph puts this information into context by showing you the relationship between functions. The call graph displays functions as nodes and calls as arcs (displayed as lines between the nodes). The nodes are annotated with the performance metrics; the arcs come with counts by default and can include other metrics as well.
In Figure 2-8, for example, the inclusive time spent by the function main is 8.107 seconds. Its exclusive time was 0 seconds, meaning that the time was actually spent in called functions. The main function can potentially call three functions. The Call Graph View indicates that in the experiment, main called three functions: getArray, which consumed 1.972 seconds; sum1, which consumed 3.287 seconds; and sum2, which consumed 2.848 seconds.
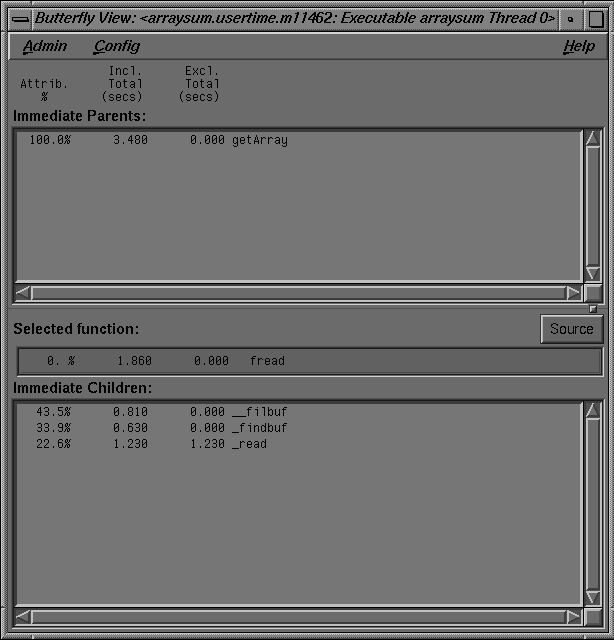
The Butterfly View shows a selected routine in the context of functions that called it and functions it called. For an illustration, see Figure 2-9.
Select a function to be analyzed by clicking on it in the function list area of the main Performance Analyzer window. The Butterfly View window displays the function you click on as the selected function.
The two main parts of the Butterfly View window identify the immediate parents and the immediate children of the selected function. In this case, the term immediate means they either call the selected function directly or are called by it directly.
The columns of data in the illustration show:
The percentage of the sort key (inclusive time, in the illustration) attributed to each caller or callee.
The time the function and any functions it called required to execute.
The time the function alone (excluding other functions it called) required to execute.
You can also display the address from which each function was called by selecting the Show All Arcs Individually from the Config menu.
The Performance Analyzer lets you view performance metrics by source line in the Source View (see Figure 2-10) or by machine instruction in the Disassembled Source view. Displaying performance metrics is set in the Preferences dialog box, accessed from the Display menu in the Source View and Disassembled Source view. The Performance Analyzer sets thresholds to flag lines that consume more than 90% of a total resource. These indicators appear in the metrics column and on the scroll bar.
The Performance Analyzer also lets you view performance metrics by machine instruction (see Figure 2-11). You can view any of the performance metrics that were measured in your experiment. If you ran an Ideal Time/Pixie experiment, you can get a special three-part annotation that provides information about stalled instructions.
The bar spanning the top of three columns in this annotation indicates the first instruction in each basic block. The first column labeled Clock in the annotation displays the clock number in which the instruction issues relative to the start of a basic block. If you see clock numbers replaced by quotation marks (“), it means that multiple instructions were issued in the same cycle. The column labeled Stall shows how many clocks elapsed during the stall before the instruction was issued. The column labeled Why shows the reason for the stall. There are three possibilities:
The Performance Analyzer lets you look for memory problems. The Leak View, Malloc View, Malloc Error View, and Heap View windows address two common types of memory problems that can inhibit performance:
Memory leakage, see “Memory Leakage”
Bad calls to free, see “Bad Frees”.
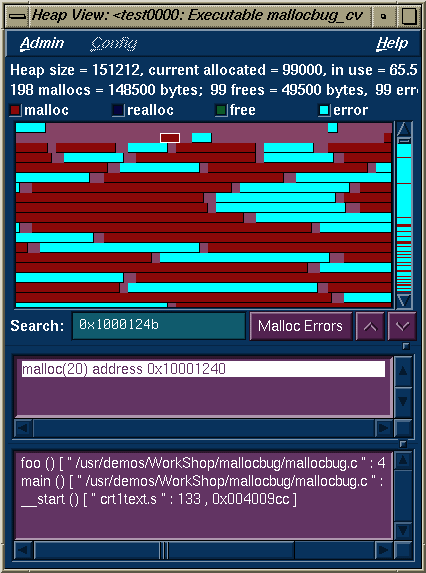
The difference between these windows lies in the set of data that they collect. Malloc Error View displays all malloc errors. When you run a memory leak experiment and problems are found, a dialog box displays suggesting you use Malloc Error View to see the problems. Leak View shows memory leak errors only. Malloc View shows each malloc operation whether faulty or not. Heap View displays a map of heap memory that indicates where both problems and normal memory allocations occur and can tie allocations to memory addresses. The first two views are better for focusing on problems; the latter two views show the big picture.
Memory leakage occurs when a program dynamically allocates memory and fails to deallocate that memory when it is through using the space. This causes the program size to increase continuously as the process runs. A simple indicator of this condition is the Total Size strip chart on the Usage View (Graphs) window. The strip chart only indicates the size; it does not show the reasons for an increase.
Leak View displays each memory leak in the executable, its size, the number of times the leak occurred at that location, and the corresponding call stack (when you select the leak), and is thus the most appropriate view for focusing on memory leaks.
A region allocated but not freed is not necessarily a leak. If the calipers are not set to cover the entire experiment, the allocated region may still be in use later in the experiment. In fact, even when the calipers cover the entire experiment, it is not necessarily wrong if the program does not explicitly free memory before exiting, since all memory is freed anyway on program termination.
The best way to look for leaks is to set sample points to bracket a specific operation that should have no effect on allocated memory. Then any area that is allocated but not freed is a leak.
A bad free (also referred to as an anti-leak condition) occurs when a program frees some structure that it had already freed. In many such cases, a subsequent reference picks up a meaningless pointer, causing a segmentation violation. Bad calls to free are indicated in both Malloc Error View and in Heap View . Heap View identifies redundant calls to free in its memory map display. It helps you find the address of the freed structure, search for the malloc event that created it, and find the free event that released it. Hopefully, you can determine why it was prematurely freed or why a pointer to it was referenced after it had been freed.
Heap View also identifies unmatched calls to free in an information window. An unmatched free is a free that does not have a corresponding allocation in the same interval. As with leaks, the caliper settings may cause false indications. An unmatched free that occurs in any region not starting at the beginning of the experiment may not be an error. The region may have been allocated before the current interval and the unmatched free in the current interval may not be a problem after all. A segment identified as a bad free is definitely a problem; it has been freed more than once in the same interval.
A search facility is provided in Heap View that allows the user to find the allocation and deallocation events for all blocks containing a particular virtual address.
The Heap View window lets you analyze memory allocation and deallocation between selected sample events in your experiment. Heap View displays a memory map that indicates calls to malloc and realloc, bad deallocations, and valid deallocations during the selected period, as shown in Figure 2-12. Clicking an area in the memory map displays the address.
The Performance Analyzer allows you to recall call stacks at sample events, which helps you reconstruct the calls leading up to an event so that you can relate the event back to your code. Figure 2-13 shows a typical call stack. It corresponds to sample event #3 in an experiment.
Working Set View measures the coverage of the dynamic shared objects (DSOs) that make up your executable (see Figure 2-14). It indicates instructions, functions, and pages that were not used when the experiment was run. It shows the coverage results for each DSO in the DSO list area. Clicking a DSO in the list displays its pages with color coding to indicate the coverage of the page.
The cord analyzer is not actually part of the Performance Analyzer and is invoked by typing sscord at the command line. The cord analyzer (see Figure 2-15) lets you explore the working set behavior of an executable or dynamic shared library (DSO). With it you can construct a feedback file for input to cord to generate an executable with improved working-set behavior.
