CASA Function: plotAlgSet
Plots algebraic sets.
Calling Sequence:
- P := plotAlgSet(A)
- P := plotAlgSet(A,options)
Parameters:
- A : algset
- An algebraic set which is to be plotted.
- options : expseq
- Options analogous to the Maple plot options.
Result:
- P : PLOT
-
Description:
- The function plots the following algebraic sets: planar curves represented implicitly, in parametric form, or by places, space curves represented implicitly, in parametric form, in projected form, or by places, surfaces represented implicitly, or in parametric form.
- Options are given as equations of the form option=value.
- All options that are used by MAPLE's plotting-functions (plot[options]) are supported. Furthermore, the range for the variables can be given. For every variable occurring in the algebraic set the user must specify a range.
- Also the option order=n is supported. This option is used for plotting places. Each formal powerseries will be developed into a power series up to order n (default is the global variable Order).
- Finally, the option style=point is supported.
Examples:
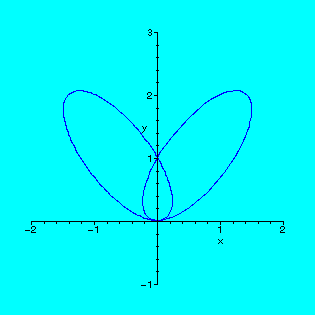
> a1:=mkImplAlgSet([2*x^4-3*x^2*y+y^2*(y-1)^2],[x,y]);
![[Maple Math]](../../../..//images/examples685.gif)
> plotAlgSet(a1,x=-2..2,y=-1..3,numpoints=200);
![[Maple Math]](../../../..//images/examples686.gif)
![[Maple Math]](../../../..//images/examples687.gif)
![[Maple Math]](../../../..//images/examples688.gif)
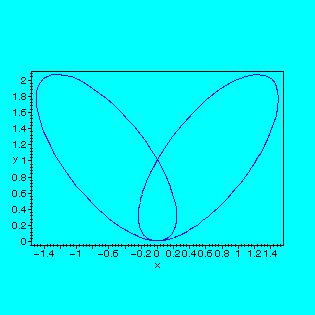
> a2:=toPara(a1,t);
![[Maple Math]](../../../..//images/examples690.gif)
![[Maple Math]](../../../..//images/examples691.gif)
> plotAlgSet(a2,t=-10..10,scaling=constrained,axes=boxed);
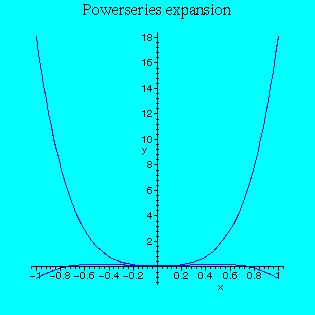
> a3:=toPlac(a1,[0,0],T);
![[Maple Math]](../../../..//images/examples693.gif)
![[Maple Math]](../../../..//images/examples694.gif)
> plotAlgSet(a3,T=-1..1,order=6,title=`Powerseries expansion`);
See Also:
[CASA]
[ssiPlot]
[pacPlot]